The Relative Strength Index (RSI) is one of the most popular tools in technical analysis, especially for beginners learning to read charts and predict market movements. In this post, I’ll explain what the RSI is, how it works, and how you can use it with simple, real-world examples.
What is the RSI?
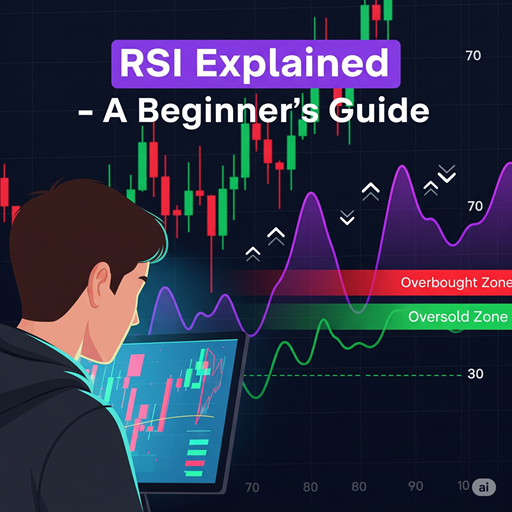
The RSI is a momentum oscillator that measures the speed and size of recent price changes. It tells you whether an asset (like a stock or cryptocurrency) is “overbought” or “oversold”—in other words, if its price has moved too far in one direction and might be due for a reversal.
- RSI values range from 0 to 100.
- Above 70 means the price might be “overbought” (too high, could fall soon).
- Below 30 means the price might be “oversold” (too low, could rise soon).
- The default look-back period is 14 days, but you can adjust this in most charting tools.
How is the RSI Calculated?
You don’t have to crunch the numbers yourself, as most trading platforms do it for you. But here’s how it works, step by step:
- Calculate the average gain and average loss over the chosen period (usually 14 days).
- Calculate the “Relative Strength” (RS):RS=Average GainAverage LossRS=Average LossAverage Gain
- Calculate the RSI:RSI=100−(1001+RS)RSI=100−(1+RS100)
Example Calculation:
- Over 14 days, if there are 7 days of average 1% gains and 7 days of average -0.8% losses:
How to Read the RSI
Overbought and Oversold
- RSI > 70: Asset may be overbought. Watch for a reversal, or consider selling/taking profits.
- RSI < 30: Asset may be oversold. Watch for a reversal, or consider buying/entering a position.
- RSI ≈ 50: Neutral market—a balance between buyers and sellers.
Example 1: Spotting Overbought and Oversold Conditions
- If a stock’s price has been rising quickly and RSI goes above 75, it could mean too many people are buying. The price might “correct” and fall soon.
- If a stock’s price drops and RSI falls below 25, it could mean too many people are selling. The price might “bounce” and rise soon.
Example 2: RSI Divergence (Reversal Signals)
- Bullish Divergence: Price makes a lower low but RSI makes a higher low. Often signals a potential price increase coming soon.
- Bearish Divergence: Price makes a higher high but RSI makes a lower high. Could signal a price drop is coming soon.
For example:
- If a stock drops from ₹120 to ₹100, but RSI moves from 25 to 30 (higher low), this could be a bullish signal.
RSI Tips for Beginners
- Don’t use RSI alone! Combine it with other indicators (like moving averages or support/resistance lines) for better results.
- Wait for confirmation: If RSI goes above 70, wait until it drops below 70 before selling. If it goes below 30, wait until it rises before buying.
- Trends matter: In strong uptrends, RSI might stay above 70 for a long time; in downtrends, RSI can stay below 30.
- Use the default 14-period setting unless you have a reason to change it.
Common RSI Mistakes
- Selling just because RSI is high or buying just because RSI is low—prices can stay overbought/oversold for extended periods.
- Ignoring trends—make sure to consider the overall direction before making decisions.
- Relying on RSI for every trade—use it as a guide, not a guarantee.
Final Thoughts
The RSI is simple to read, useful for spotting potential reversals, and great for beginners. Remember:
- RSI >70: Watch for selling opportunities.
- RSI <30: Watch for buying opportunities.
- Always confirm with other tools and use RSI as part of your overall trading plan.
With practice, you’ll get better at spotting “overbought” and “oversold” moments—and making smarter trading decisions!